
Innovative Multiplex Analysis


Imagine seamless multi-platform operation, lightning-fast processing speeds, outstanding stability & reliability, superior file format compatibility, unprecedented real-time updating, smarter analysis tools, and an elegant user interface.
|
layout
Setting and Visualisation |
Setup – Check – Evaluate – Annotate
Plate layout and data attribute and settings management, quick quality-control visualisation, feature-packed without clutter – plate layout with unparalleled ease at surprising speed |
|
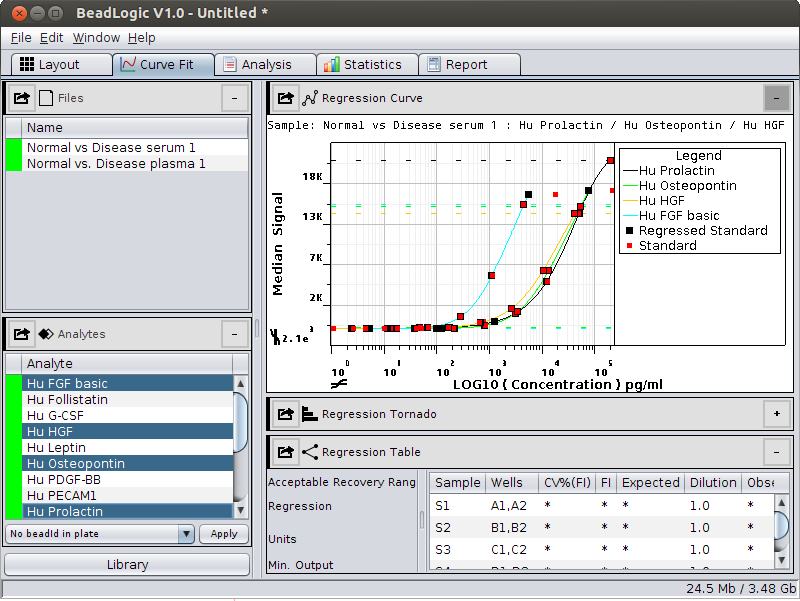
| curve fit
Verification and Validation |
Plot – Optimise – Validate
Unique features, Tornado plot and Red Light/Green Light signaling of appropriate curve regression and unprecedented automatic fit functionality turn curve optimisation into a painless validation exercise. |
|
| analysis
Power of analysis made easy |
Mine – Aggregate – Explore
Unique, simple to use yet powerful, data-mining and reduction tool for the extraction of aggregated data points determining correlation with data-mining features that feed directly into graphlogic™. |
|
| graphlogic™
Plot Statistics, Hassle-Free |
Graph – Analyse – Compare
Plot your statistics without having to leave your analysis program. With graphlogic™ it takes seconds to generate publication-ready graphs, all linked to your live analysis. |
|
| doclogic™
Analysis Results, Ready To Show |
Print – Publish – Present
When it comes to reporting, presenting and record keeping nothing beats doclogic™ – an unrivalled collection of annotation tools and advanced printing and publishing options. |